Validation of Glycemic Index Values Represented as Bar Graphs in Scholarly Articles for Clinical Nutrition Application
DOI:
https://doi.org/10.37934/jhqol.1.1.115Keywords:
Glycemic index, Glycaemic index, ImageJ bar, Bar graph analysis, Precision nutrition;, Clinical nutritionAbstract
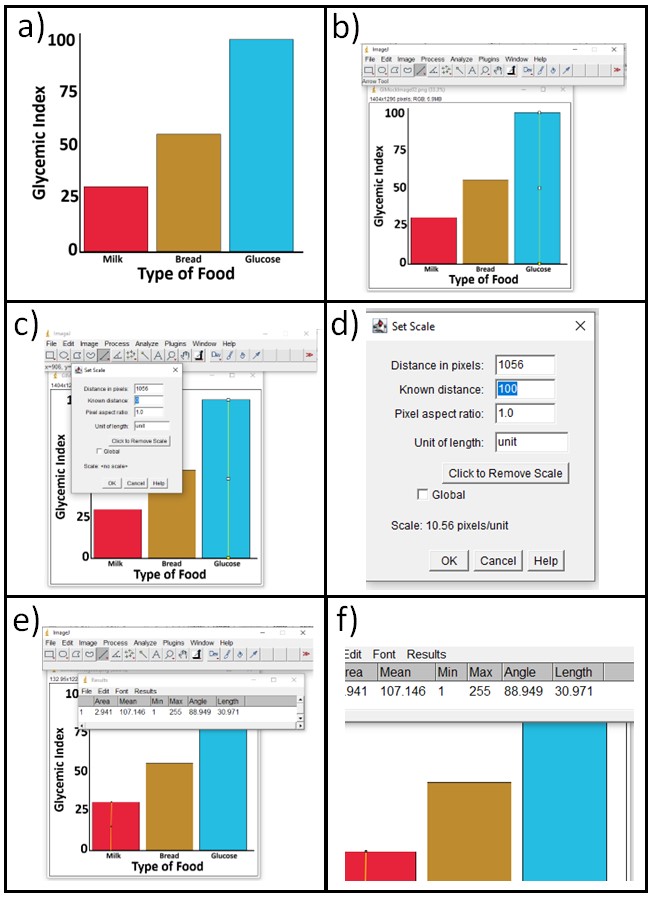
Glycemic index (GI) has been a proven clinical nutrition tool. It has been utilized in chronic diseases such as PCOS, diabetes, obesity and metabolic syndrome. The GI value of a test food is the ratio of the glucose response over 2 hours against the reference food. The references food is usually either glucose or bread. GI values may often be directly available as values in texts, tables, or figures. The indirect values may be represented as values, images or both values and, concentration of glucose over time or GI values. Less ideally, some GI data are only presented in graphs. Data from these graphs without direct values could be extracted but this potentially contributes to less accurate results. Here, we investigate the extracted outcome from the original data and if their differences could affect the GI values. There are a few software’s and methods that may be used for data extraction; however, they are costly and complex. Also, different types of graphs require different extraction methods. Herein, we describe a simple reproducible method for extracting data from bar graphs using the freeware ImageJ. Seven extractors extracted 102 outcome values from 19 different scholarly articles. Differences between extractors were compared using the Overall Concordance Correlation Coefficients (OCCC), whereas differences between the original and extracted data were compared using the Lin’s Concordance Correlation Coefficients (CCC) and Bland-Altman. Both the OCCCs and CCCs were high for both outcome values and errors, while the CCCs were good and acceptable for the outcome. The Bland Altman showed good agreement between the extracted outcome and the true reported GI values. Therefore, the current method supports the extraction GI values from bar graphs in published scholarly articles even in their absence in text.
Downloads
Downloads
Published
How to Cite
Issue
Section