Heatmap Visualization Approach for Descriptive Analytics of Covid-19 Cases in Malaysia
DOI:
https://doi.org/10.37934/araset.34.2.117Keywords:
Covid-19, descriptive analytics, calendar heatmap, D3 algorithmAbstract
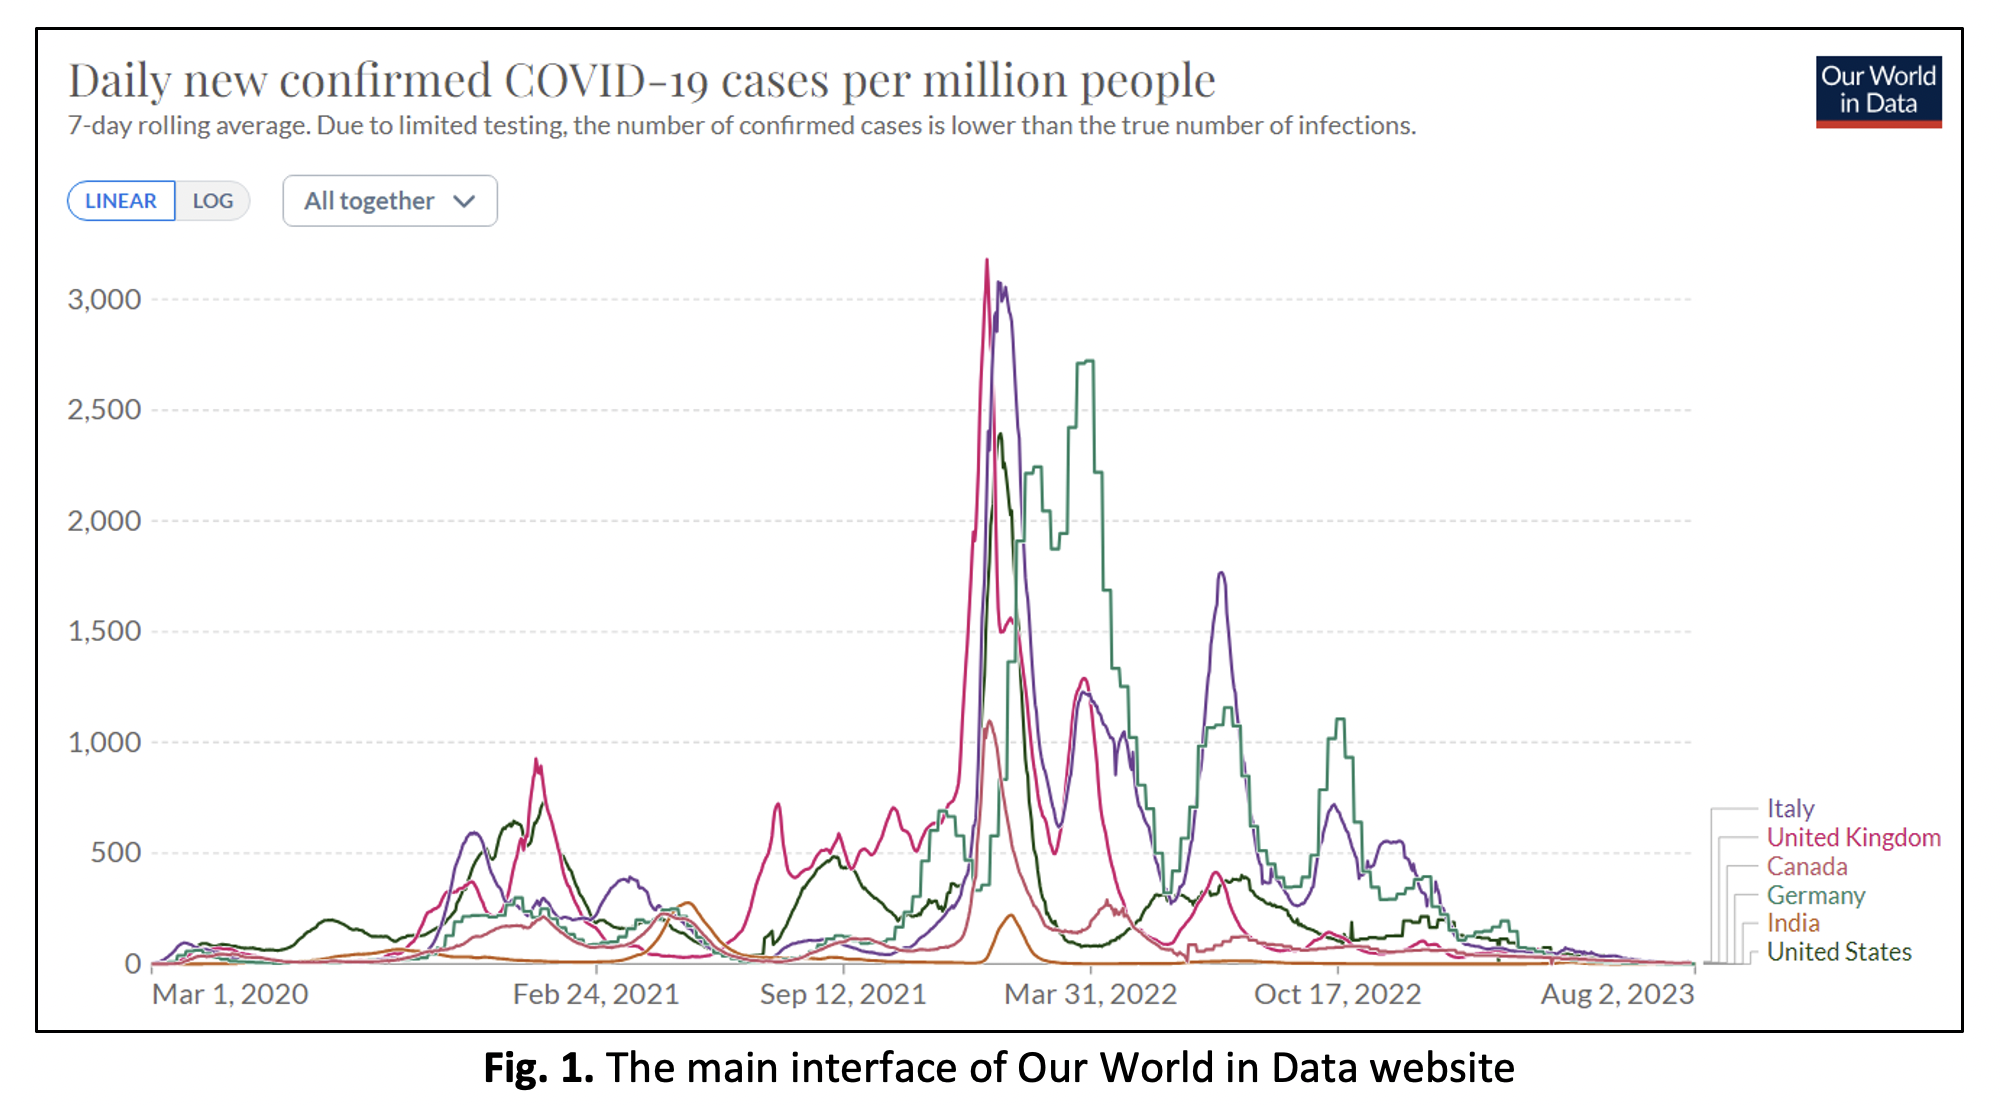
The Covid-19 pandemic has presented unparalleled obstacles to the world, including Malaysia and Indonesia. A visual analytics approach known as the Covid-19 heatmap visualization is proposed to provide relevant and timely information about Covid-19 daily cases and deaths in Malaysia. The aim of this approach is to offer a platform for various stakeholders to make informed decision based on descriptive analytics. The Covid-19 information visualization approach allows users to compare different types of visualizations such as heatmaps, line charts, and bar charts to detect Covid-19 trends or patterns. The approach is implemented as a web-based system using D3 JavaScript library and tested using the data collected from Coronavirus Pandemic Data Explorer. Results show that the Covid-19 heatmap visualization approach is an invaluable approach for understanding pandemic trends as it provides users with easy access to visualizations and fast understanding of Covid-19 situations such as daily cases, deaths and recoveries. The target users for the proposed approach are the National Security Council and Ministry of Health staff, company crews, and the general public. Future upgrades to the approach includes adding additional attributes such as the number of tests and recoveries to assist users in making predictive analytics using machine learning models.
Downloads
