Robust Control Chart Application in Semiconductor Manufacturing Process
DOI:
https://doi.org/10.37934/araset.43.2.203219Keywords:
Robust statistics, Control limit, Attributes, DefectivesAbstract
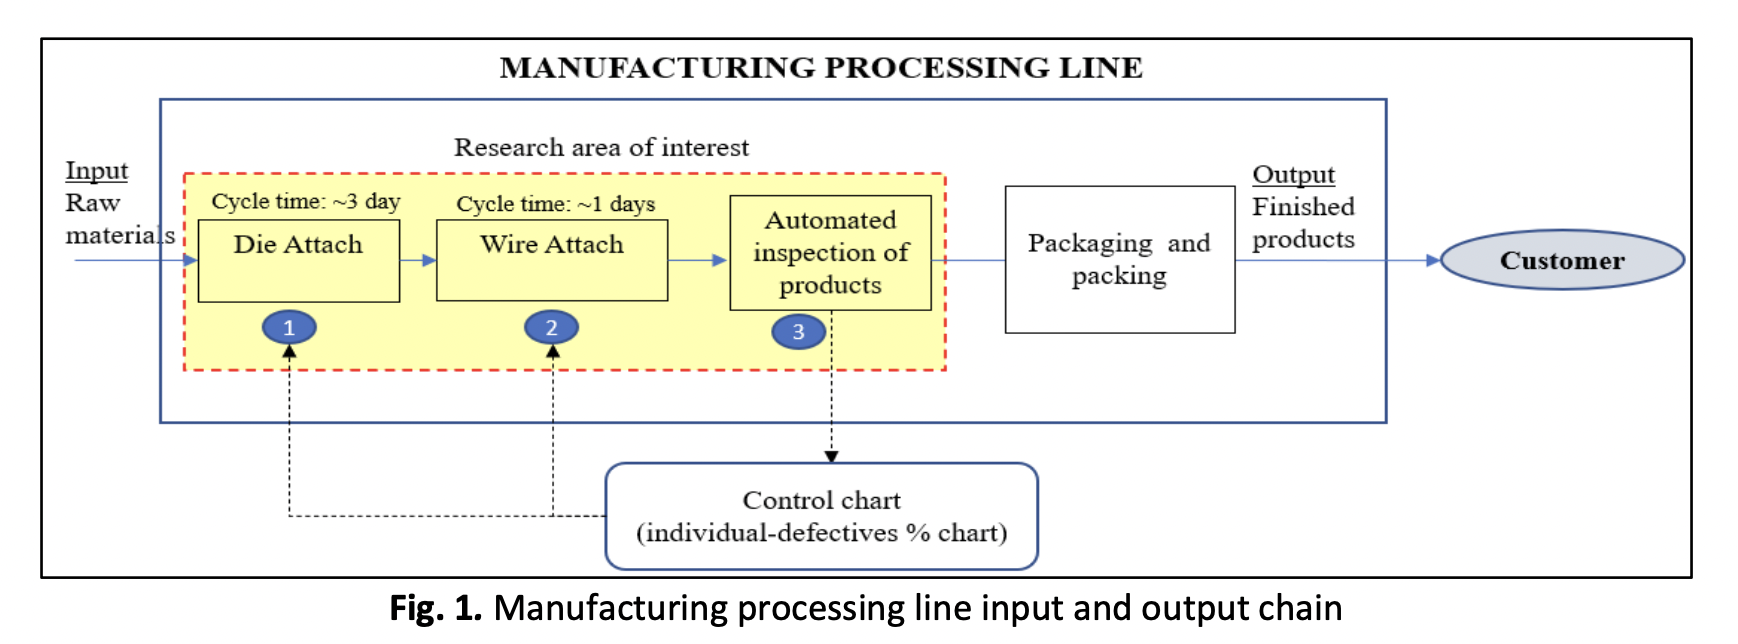
Statistical Process Control (SPC) charts are frequently used in the semiconductor manufacturing environment to monitor process quality and detect special-cause variations, hence, to take corrective actions when necessary. The important aspects of control charts to consider on production floors are identifying the primary objective of implementing control charts, the type of data to monitor and the most appropriate control limits to establish. When the quality data is a type of attribute data like the proportion of defectives from a production lot, a p-chart approach is most suitable. In p-chart applications, although the assumption of normally distributed process data is not mandatory, the widespread practice is to assume the normal distribution of process data when establishing the control limits. Yet again, the reality of industrial settings is that process data are most likely influenced by outliers, resulting in highly skewed distributions. This paper addresses these issues by proposing robust SPC charting techniques to detect special-cause variations in the semiconductor manufacturing processes. Here, we present a case study of a semiconductor company in Malaysia, Dominant Opto Technologies Sdn. Bhd. to propose three robust statistical approaches for monitoring the proportion of defectives in production lots. We apply M-estimates, median, and interquartile range to calculate the upper control limits (UCL) and found that robust estimators are more effective in detecting early process deterioration and capturing the out-of-control (OOC) conditions better than traditional control charts. By proposing robust methods, this study enlightens the practical aspects of process quality improvement for real-life manufacturing setups. Because a high OOC rate may impact manufacturing productivity, we recommend the decision-makers choose the types of control charts based on the implications of each robust approach toward quality and productivity. The significance of this study includes providing insights into setting up the appropriate attribute control charts for detecting defective proportions for professionals and SPC researchers working in these areas.
Downloads
Downloads
Published
Issue
Section