Text Analytics: "Graphic Visualization in Education and a Scientometric Analysis Using R Tool to Explore the Impact and Trends in Classroom Learning."
DOI:
https://doi.org/10.37934/araset.40.2.112Keywords:
Text Analytics, Graphic Visualization, Artificial Intelligence, Technology AidsAbstract
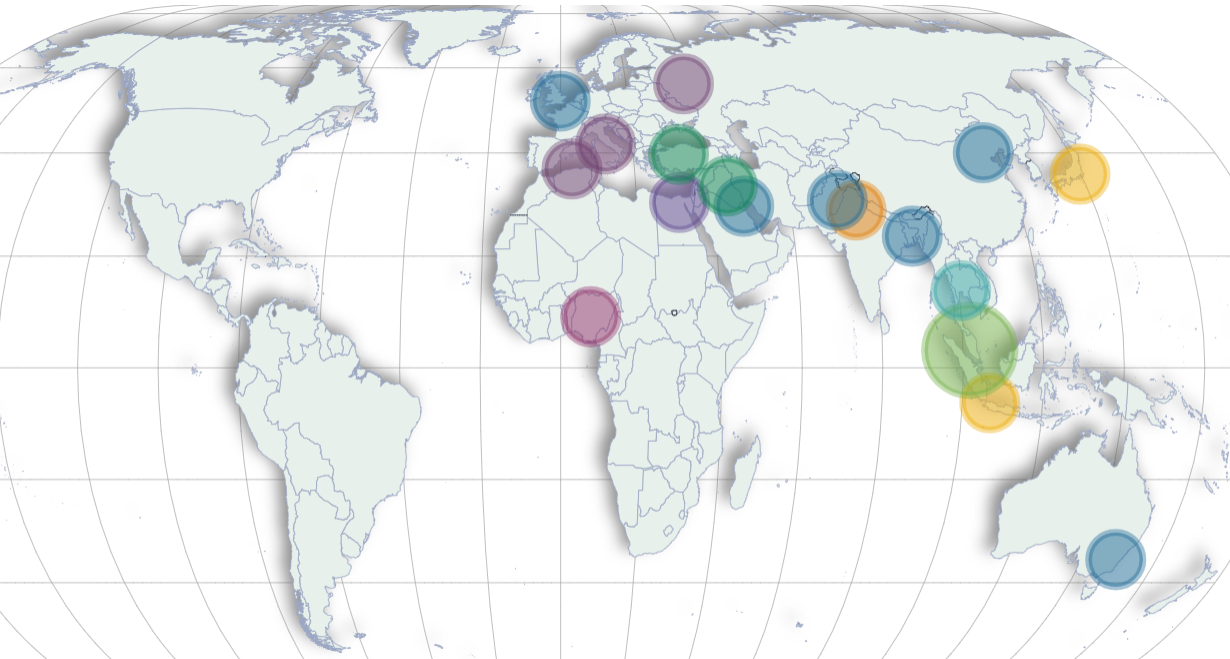
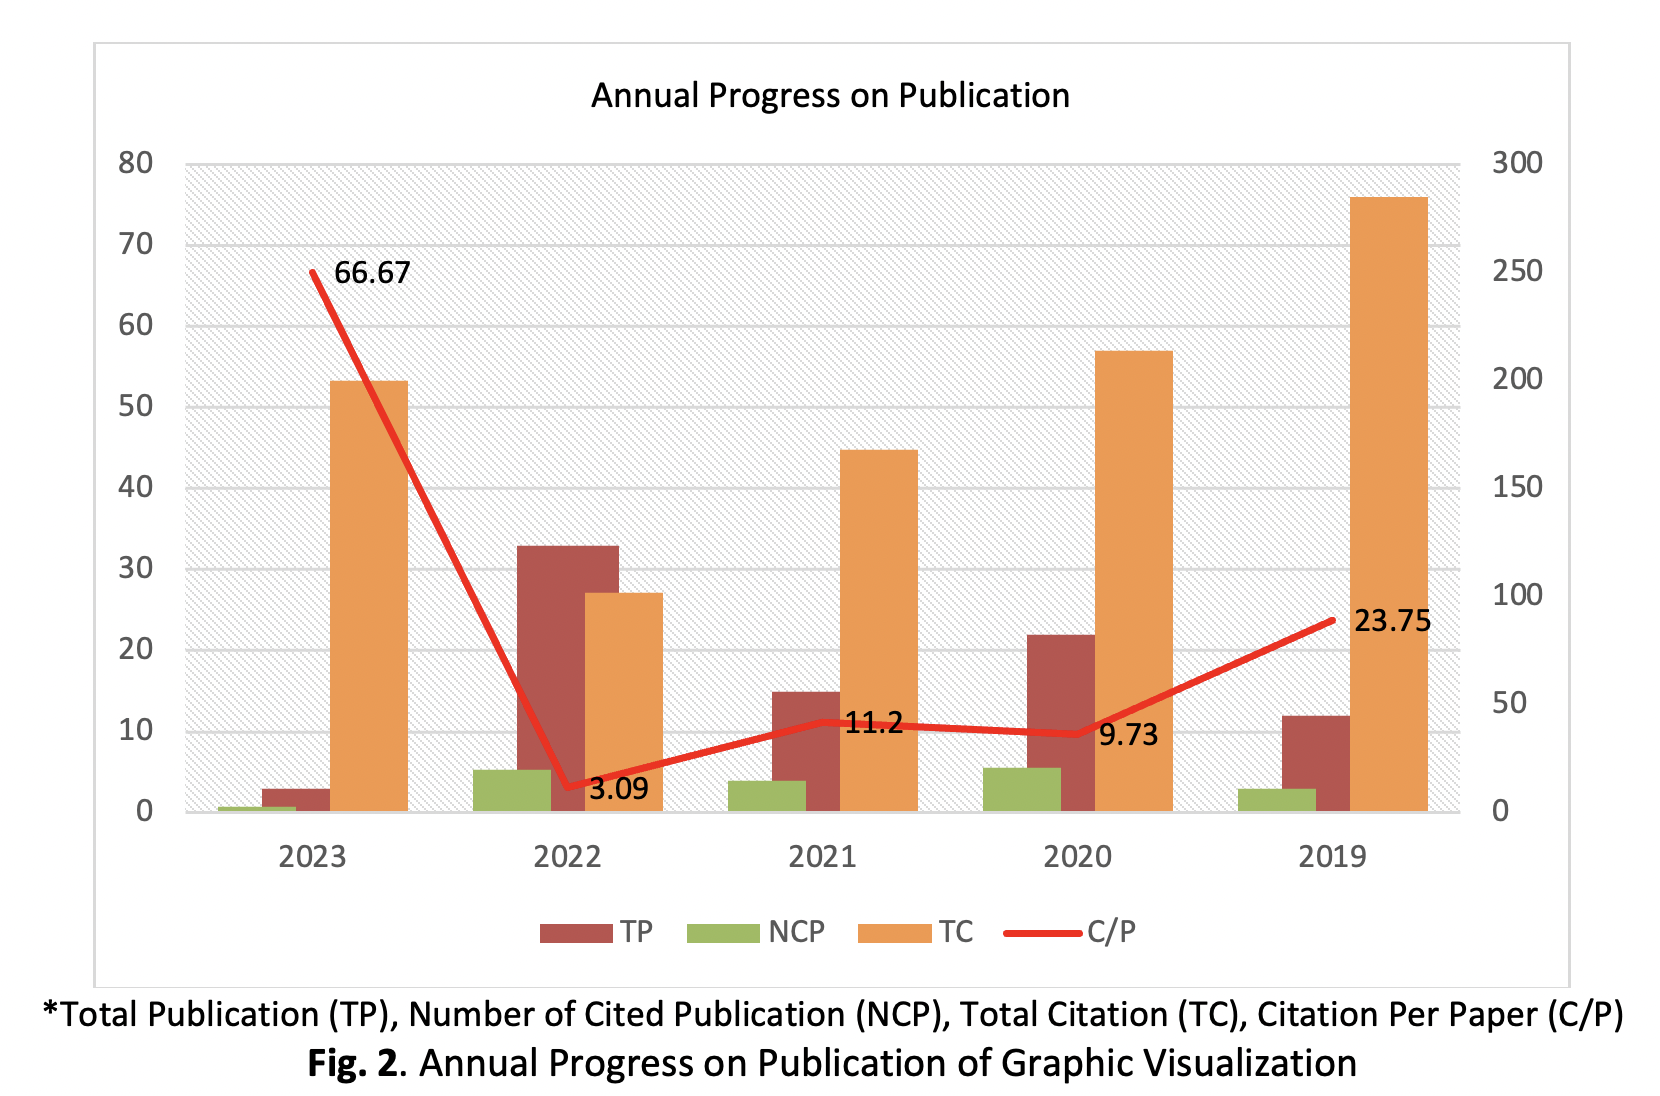
Text analytics can be applied in education to gain insights into student learning, teacher performance, and educational trends by analysing various forms of text-based data such as student essays, social media posts, and educational resources. While the need for teacher preparation and training is identified, specific solutions or effective strategies for equipping educators with the skills and knowledge to integrate graphic visualizations into their teaching practices might be underexplored. This Scientometrics study used PRISMA approach (Preferred Reporting Items for Systematic Review and Meta-Analysis) Using R tool. Scopus databases that were relevant to the research topic, and its standardized procedures ensured comprehensiveness and replicability. The study found 85 articles using the PRISMA approach from the Scopus database, with 98.82% being articles and 1.18% from conference proceedings. The number of articles published increased in 2022, with 33 articles, compared to 22 articles in 2020. The total number of cited papers was 70, with a total citation of 969. This indicates an increase in research related to graphic visualization in education due to technological advancements. The citation per cited paper was 119. Besides, the study identifies the top 10 countries that have conducted research in graphic visualization, with the United States leading with 19 studies followed by China with 12 and Spain with 8. The top three subject areas in the current research trends are Computer Science education with 78 publications, Engineering education with 33, and Social Science education with 14. Other fields related to language and linguistics are also being given special attention. These findings suggest that education systems and research in education are keeping up with global developments. There is potential for visualizations to be integrated with AI technologies to provide personalized learning experiences, while ensuring that visualizations are accessible to all students, including those with visual impairments. Studies have shown that using these approaches in education can enhance student learning and understanding of complex concepts.
Downloads
Downloads
Published
How to Cite
Issue
Section