Modified Levey-Jennings Chart with Robust Estimator: A Case of Semiconductor Manufacturing Process
DOI:
https://doi.org/10.37934/araset.43.2.189202Keywords:
Robust statistics, Automated control chart, Levey-Jennings, Non-stationaryAbstract
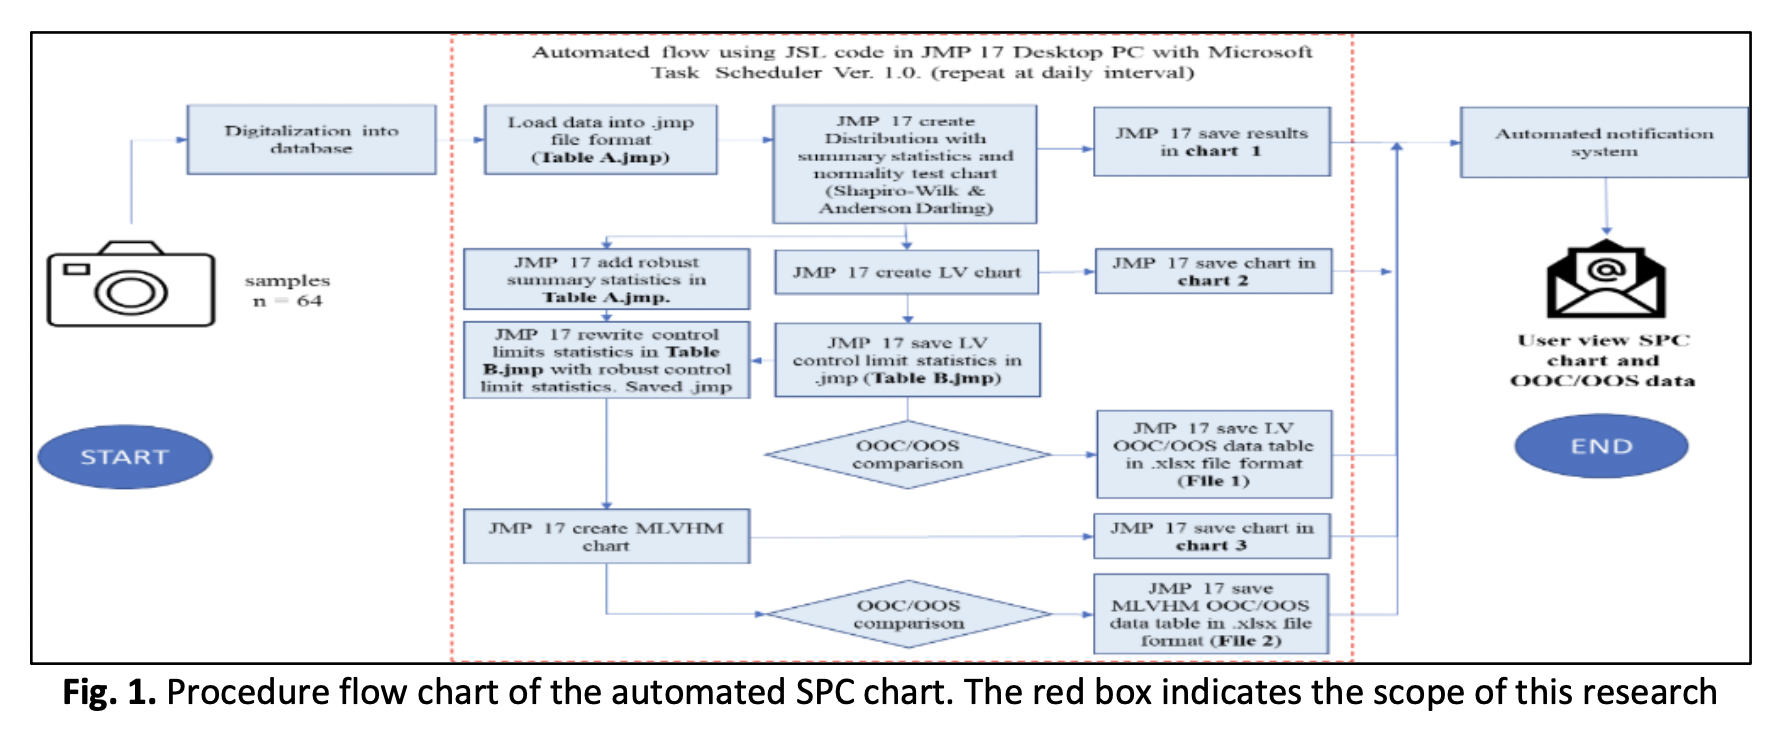
In the era of Industrial Revolution 4.0 and smart manufacturing, the development and deployment of control charts used in the semiconductor industry need to be automated. Consequently, artificial intelligence-based automation methods typically encompass the deployment of statistical software such as JMP. Automation involves frequent dataset updates; the control limits are recalculated as the parameters change (non-stationary behaviour). This requires the user to define the control chart type before its deployment on the production floor. An initially normally distributed dataset may be skewed during the process owing to the influence of outliers. If a user selects a chart based on normality assumptions, detecting a process-mean shift may be impossible if the recalculated limit fluctuates. In the semiconductor industry, a process-mean shift occurs owing to special cause variations in the process. This signals process deterioration, which may affect the quality of the product. It is unknown when outliers will affect the equilibrium of normality assumptions; therefore, it is important to develop an automated, robust control chart that can detect special cause variations under non-stationary conditions. This study proposes the use of Huber’s M-estimators in the Levey-Jennings chart to detect special cause variations in a semiconductor manufacturing process. This study computes the robust M-estimates of all available samples to calculate the new limits in the Levey-Jennings chart. This new chart is referred to as the modified Levey-Jennings with a robust Huber M-estimator (MLVHM). Using production data from Dominant Opto Technologies Sdn. Bhd., Malaysia, a statistical comparison of the MLVHM and Levey-Jennings charts was performed. While the MLVHM is stable, the absolute difference in dispersion between the two charts ranges between 25.26% and 47.91% owing to standard deviation variation in the Levey-Jennings chart in non-stationary situations with outliers. The study concludes that the MLVHM chart is robust and suitable for industrial automatic flow applications.
Downloads
